Vai al contenuto


Europe Whitepaper (West vs East Europe | Labor-Saving ROI Only)
Introduction
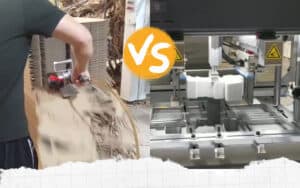
Waste removal operations represent one of the last major manual bottlenecks in European packaging production. While die-cutting has modernized, many facilities still rely on pneumatic-assisted or manual stripping—processes that consume labor, introduce variability, and limit throughput potential.
This analysis quantifies the labor-only business case for upgrading to automatic blanking technology. We focus exclusively on measurable labor savings, setting aside quality improvements, downtime reduction, and throughput gains that many plants also experience.
The data reflects real operational differences between Western and Eastern European facilities: labor costs, pile handling practices, and workforce structures. Whether you run a lean micro-enterprise or a high-volume production plant, you’ll find regionally-aware ROI scenarios grounded in 2024 market data.
Scope: Labor savings only. No quality, scrap, or lead-time benefits included.
Geography: West and East Europe operational parameters.
Equipment: Industrial-grade automatic blanking machines (€17k–€42k range).
Baseline: Pneumatic-assisted waste removal (current practice in most facilities).
Executive Summary
Current State:
- Pneumatic-assisted waste removal: 25–40 minutes per pile (including handling)
- Manual reference: 1.0–1.5 hours per pile
- Automatic blanking: 6,500 sheets/hour effective throughput (conservative, field-verified)
Labor Cost Assumptions (2024 Eurostat manufacturing sector data):
- West Europe: €32/hour fully-loaded
- East Europe: €13/hour fully-loaded
Key Findings:
West Europe (3,500 sheets/pile, €32/hr):
- Micro plants: €71.7k/year saved → 2.8 months payback (€17k CapEx)
- Small plants: €196.9k/year saved → 1.0 month payback (€17k CapEx)
- Medium plants: €1.99M/year saved → 0.10 months payback (€17k CapEx)
East Europe (2,500 sheets/pile, €13/hr):
- Micro plants: €63.6k/year saved → 3.2 months payback (€17k CapEx)
- Small plants: €174.8k/year saved → 1.2 months payback (€17k CapEx)
- Medium plants: €1.29M/year saved → 0.16 months payback (€17k CapEx)
Investment Range: €17k / €30k / €42k (USD ~20k–50k) for industrial-grade equipment.
1) Plant Segmentation and Assumptions
1.1 SME Size Framework (Europe)
Based on EU SME definition by headcount:
- Micro: <10 employees
- Small: <50 employees
- Medium: <250 employees
1.2 Throughput (Annual Volume)
Annual sheet-processing capacity converted from m²/year using:
Average sheet area: 0.70 m²/sheet (modeling assumption)
Annual volumes used (midpoint of each range):
| Plant Size | Annual m² | Annual Sheets |
|---|---|---|
| Micro | 20M | 28.6M |
| Small | 55M | 78.6M |
| Medium | 140M | 200.0M |
Note: You can adjust the 0.70 m²/sheet assumption based on your product mix. ROI direction remains consistent; only magnitude changes.
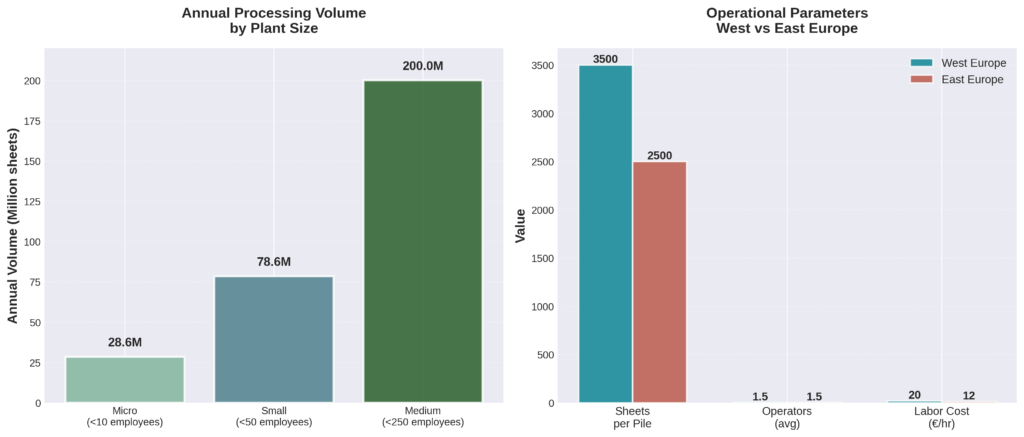
1.3 West vs East Europe Operational Differences
Sheets per pile:
- West Europe: 3,500 (higher due to automated warehousing)
- East Europe: 2,500 (lower due to manual handling practices)
Operators:
- Micro/Small: 1.5 (typical range: 1–2 people)
- Medium: 3.0 (typical range: 2–4 people)
Loaded labor cost (2024 Eurostat manufacturing sector):
- West Europe: €32/hour (representative of EU manufacturing average)
- East Europe: €13/hour (representative of Romania/Bulgaria corridor)
These figures include social contributions, benefits, and employer taxes. Actual costs vary by country—Germany €48/hr, Poland €17/hr, etc.
2) Methods: Labor-Only ROI Model
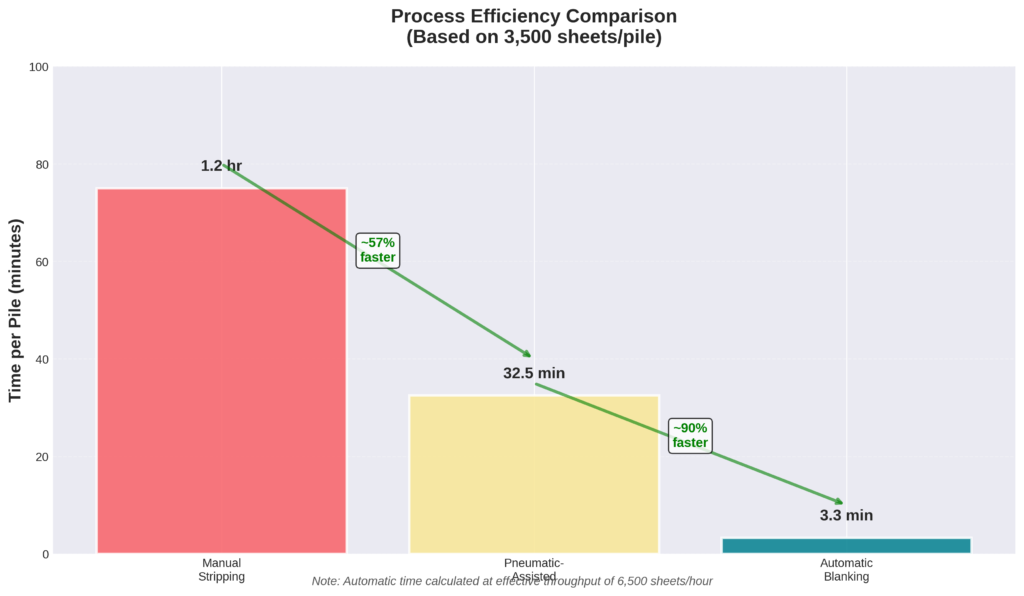
2.1 Time Standards (Baseline vs Automatic)
Pneumatic-assisted (baseline): 25–40 min/pile
→ We use 32.5 min/pile (midpoint) for calculations.
Manual (reference only): 1.0–1.5 h/pile
Automatic (effective throughput): 6,500 sheets/hour
→ Field-verified speed accounting for loading/unloading, job changes, and rhythm losses.
→ Nameplate speeds (8,000–10,000 sheets/hour) are intentionally de-rated for real-world conditions.
2.2 Equations
Piles per year:
Piles = Annual Sheets / Sheets per Pile
Baseline labor hours (pneumatic-assisted):
Hours_pneumatic = Piles × Time_per_pile × Operators
where Time_per_pile = 0.5417 hours (32.5 minutes)
Automatic labor hours:
Hours_auto = Annual Sheets / 6,500
(assumes single-operator operation)
Annual labor cost:
Cost = Hours × Loaded Labor Rate
Labor savings:
Savings = Cost_pneumatic - Cost_auto
Payback period (months):
Payback = (CapEx / Savings) × 12
3) Results: Annual Labor Savings
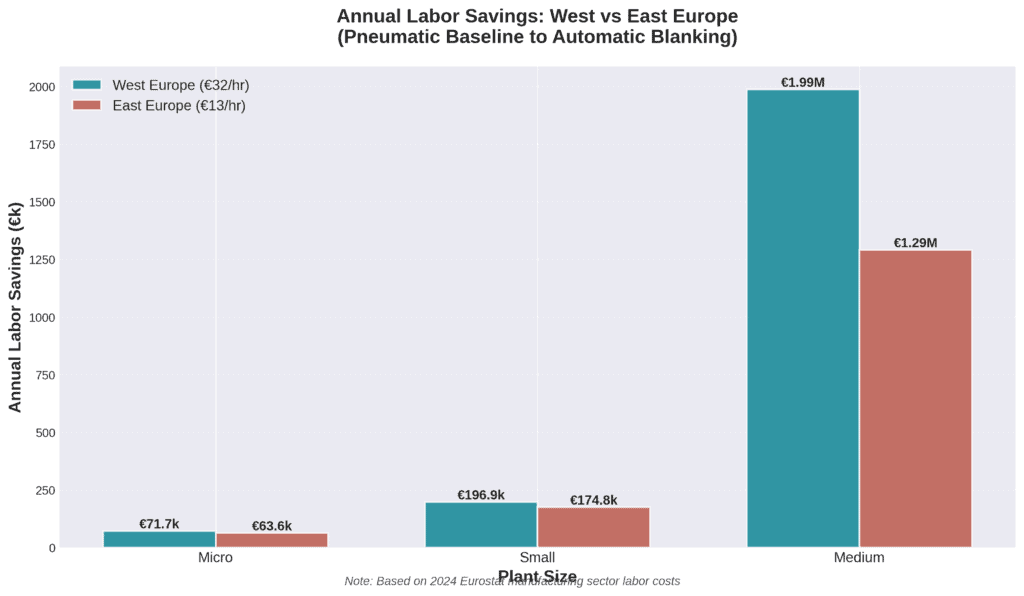
3.1 West Europe Scenario
(3,500 sheets/pile, €32/hour)
| Plant Size | Annual Sheets | Annual Savings | Hours Saved |
|---|---|---|---|
| Micro | 28.6M | €71,700 | 2,241 |
| Small | 78.6M | €196,900 | 6,153 |
| Medium | 200.0M | €1,987,000 | 62,094 |
3.2 East Europe Scenario
(2,500 sheets/pile, €13/hour)
| Plant Size | Annual Sheets | Annual Savings | Hours Saved |
|---|---|---|---|
| Micro | 28.6M | €63,600 | 4,892 |
| Small | 78.6M | €174,800 | 13,446 |
| Medium | 200.0M | €1,291,000 | 99,308 |
Why East Europe saves substantial amounts despite lower wages:
Smaller pile sizes (2,500 vs 3,500 sheets) increase pile-handling frequency by 40%. Since pneumatic work is measured per pile, this multiplies labor hours even at lower hourly rates. Automatic machines process by sheets/hour regardless of pile size, creating larger efficiency gaps.
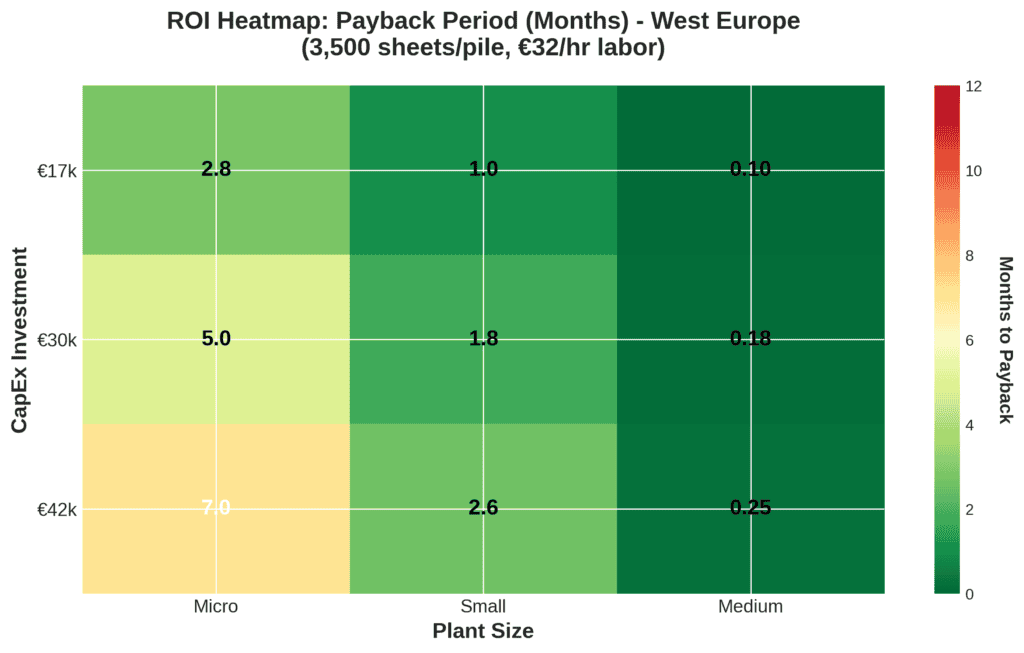
4) ROI Heatmap: Payback Months
CapEx Bands (Industrial-Grade Equipment)
Three investment levels aligned to market pricing:
- €17k (entry industrial)
- €30k (mid-range industrial)
- €42k (high-spec industrial)
These correspond to USD ~20k–50k at current exchange rates.
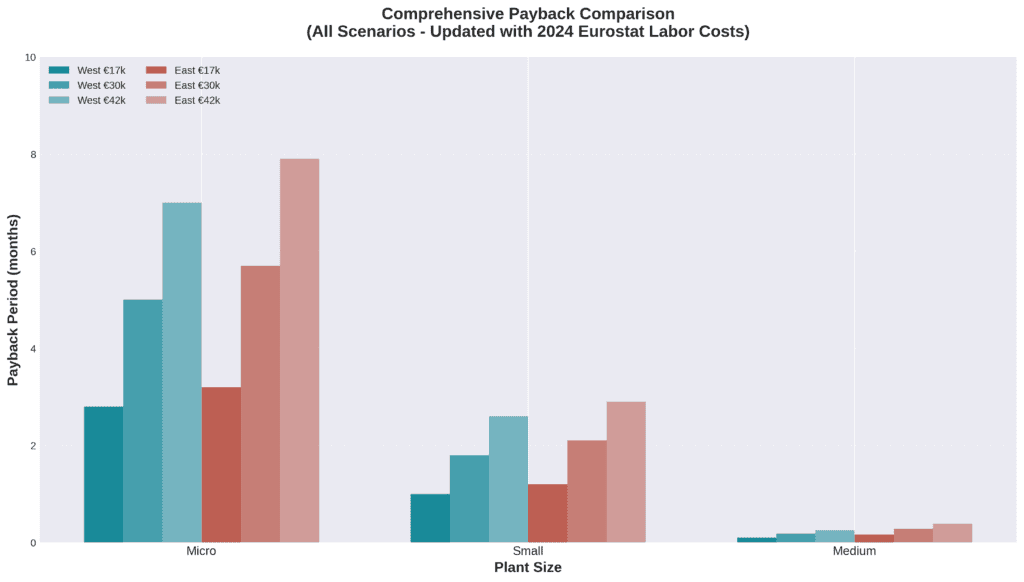
4.1 West Europe Payback (Months)
| Plant Size | Annual Savings | €17k | €30k | €42k |
|---|---|---|---|---|
| Micro | €71.7k | 2.8 | 5.0 | 7.0 |
| Small | €196.9k | 1.0 | 1.8 | 2.6 |
| Medium | €1,987k | 0.10 | 0.18 | 0.25 |
4.2 East Europe Payback (Months)
| Plant Size | Annual Savings | €17k | €30k | €42k |
|---|---|---|---|---|
| Micro | €63.6k | 3.2 | 5.7 | 7.9 |
| Small | €174.8k | 1.2 | 2.1 | 2.9 |
| Medium | €1,291k | 0.16 | 0.28 | 0.39 |
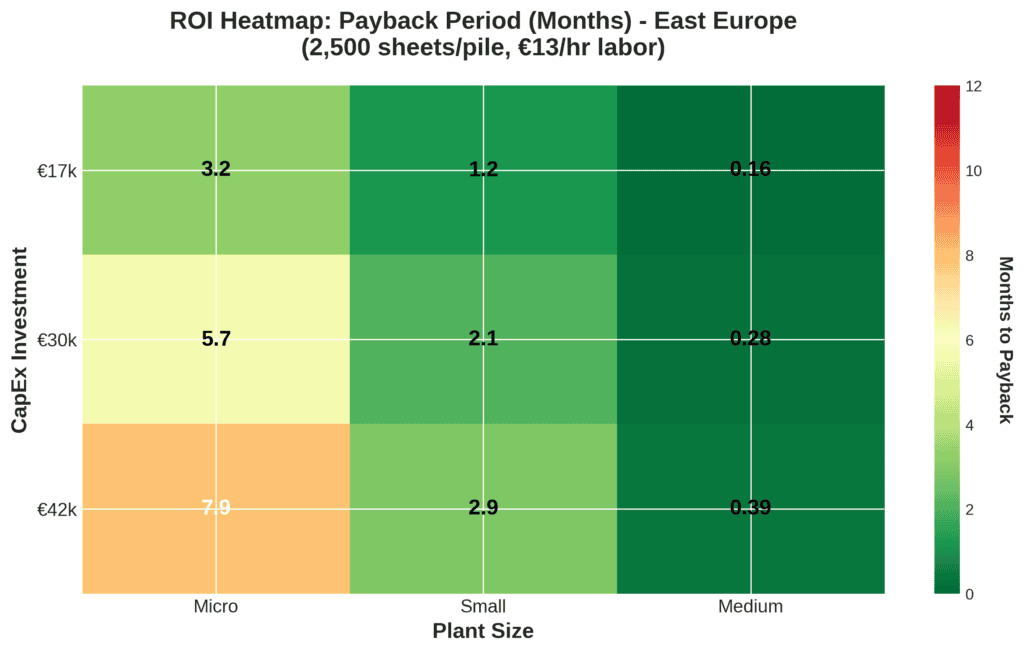
Reading the table: Green cells indicate sub-3 month payback (excellent). Yellow cells indicate 3-6 months (strong). All scenarios achieve payback within one year.
5) Manual Reference (Context)
Some facilities—especially micro operations with highly variable work—still rely heavily on manual stripping.
Time comparison:
- Manual: 1.0–1.5 hours/pile
- Pneumatic: 0.42–0.67 hours/pile (25–40 minutes)
- Automatic: 0.05–0.06 hours/pile (3–4 minutes for 3,500 sheets @ 6,500/hr)
Labor intensity multiplier:
Manual consumes 1.5× to 3.6× more labor per pile than pneumatic, depending on where pneumatic sits in the 25–40 minute range.
For plants closer to the manual baseline, automatic ROI exceeds the heatmap values shown (which use pneumatic as the baseline).
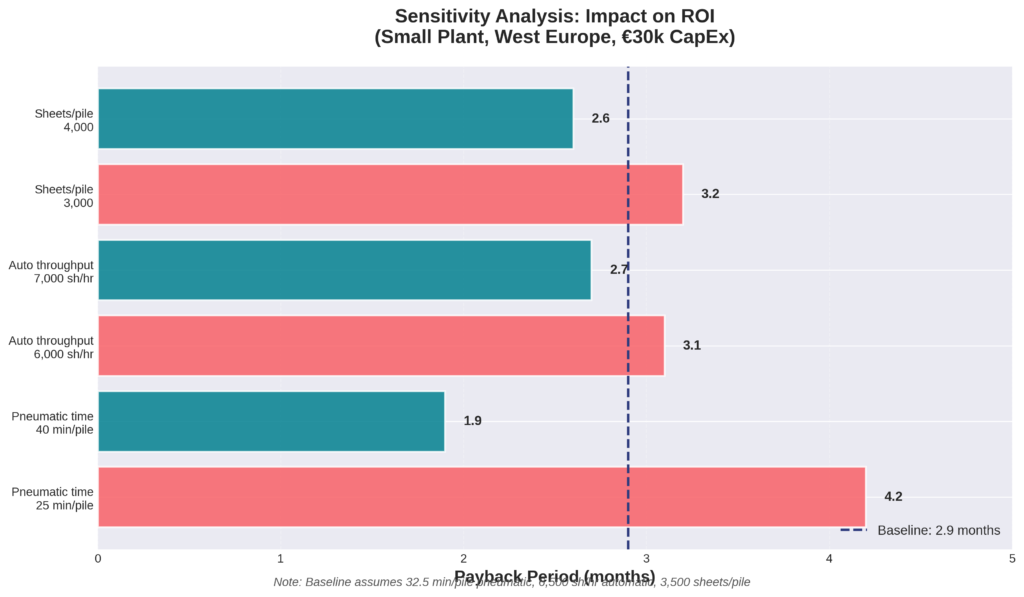
6) Sensitivity: What Moves ROI Most
This is a labor-only model. Three variables drive results:
1. Baseline pneumatic time per pile (25–40 min)
→ Single biggest driver. A facility at 40 min/pile sees 60% stronger ROI than one at 25 min/pile.
2. Effective automatic throughput (6,000–7,000 sheets/h)
→ ±7–8% impact on automatic labor hours.
3. Sheets per pile (West vs East)
→ Directly changes baseline pile count. Lower sheets/pile = more piles = more pneumatic labor = stronger ROI.
Validation approach:
Track one week of actual data:
- Average sheets per pile
- Pneumatic minutes per pile (including handling)
- Operator count per shift
Feed these into the equations above for facility-specific ROI.
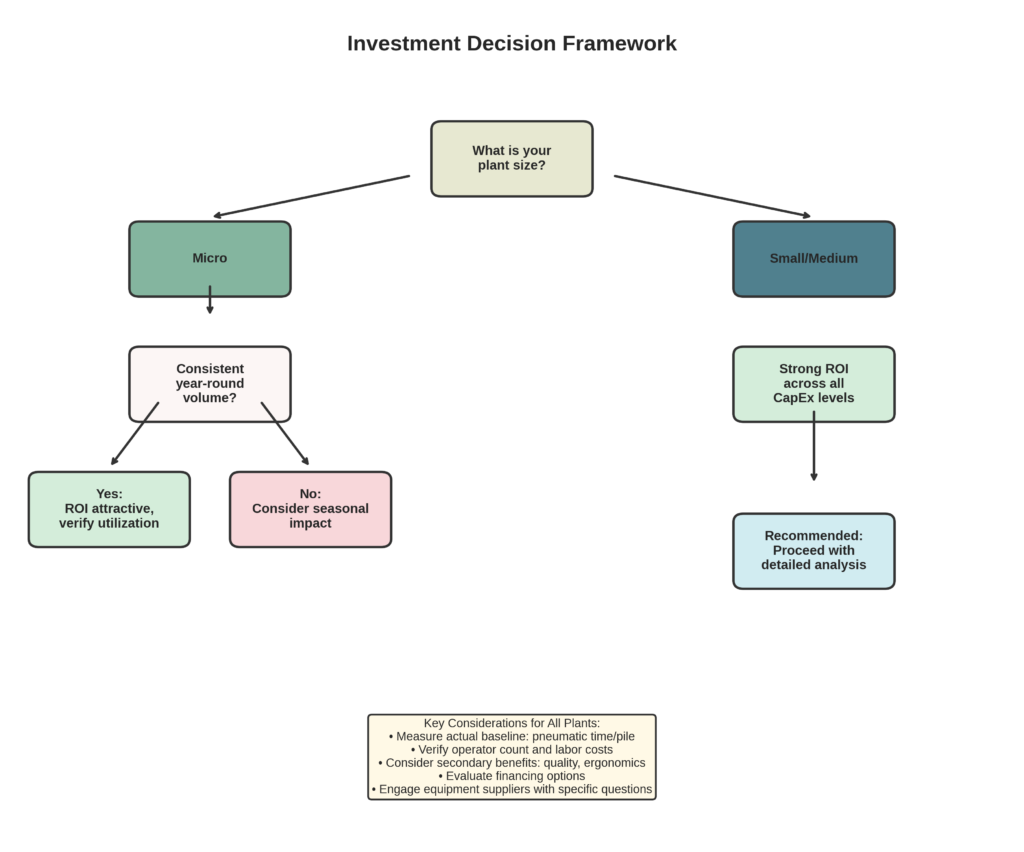
7) Recommendations
Small & Medium plants (West or East):
Strong labor-only ROI across all CapEx bands. Payback measured in months, not years.
Micro plants:
ROI remains attractive if waste removal operations are consistent year-round. Seasonal or highly variable operations should verify utilization before committing capital.
Key consideration for all sizes:
This analysis captures labor savings only. Most plants also report:
- Improved ergonomics (reduced physical strain)
- More consistent quality (fewer handling errors)
- Faster job changeovers
- Reduced material waste
These secondary benefits strengthen the business case but are not quantified here.
Conclusion: Data-Driven Investment Decisions
The numbers tell a clear story: for small and medium-sized European packaging operations, automatic blanking delivers compelling labor-only ROI. Medium plants can recover a €30k investment in under one month. Small plants achieve payback in 1–2 months. Even micro enterprises see sub-year returns with proper utilization.
Regional Insights
West Europe: Higher labor costs (€32/hr) create strong absolute savings. The pneumatic baseline already consumes €365k–€1.99M annually in labor for small-to-medium plants.
East Europe: Despite lower wages (€13/hr), smaller pile sizes drive higher handling frequency. This operational reality keeps labor consumption—and therefore savings potential—substantial.
Beyond the Spreadsheet
Labor savings are the foundation of this analysis because they’re measurable and defensible. But the full value story includes factors harder to quantify in a whitepaper:
Operator wellbeing: Pneumatic tools reduce strain versus manual work, but automatic systems eliminate repetitive physical stress entirely.
Quality consistency: Human fatigue and variability decrease with automation, reducing defect rates and customer complaints.
Production flexibility: Faster processing enables shorter lead times and more responsive scheduling.
Competitive positioning: Lower per-unit costs and higher capacity utilization strengthen market position.
Your Next Steps
1. Measure your baseline (one week is enough):
- Actual pneumatic time per pile (include handling)
- Sheets per pile (average)
- Operator count per shift
- Current loaded labor rate (verify with HR/finance)
2. Calculate your ROI using the equations in Section 2.2 with your actual data.
3. Engage equipment suppliers with specific questions:
- Effective throughput for your product mix (not just nameplate speed)
- Job changeover time
- Maintenance requirements
- Training and ramp-up timeline
4. Consider the full business case:
- Labor savings (quantified here)
- Quality improvements (defect reduction, consistency)
- Capacity gains (throughput, lead time)
- Workforce development (upskilling vs. repetitive tasks)
Final Thought
The European packaging industry faces persistent labor challenges: skilled workforce shortages, rising costs, and increasing customer demands for speed and quality. Automatic blanking technology won’t solve every challenge, but for many operations, it represents a practical, data-driven step toward sustainable efficiency.
The best investment is the one that aligns with your operational reality, financial capacity, and strategic vision. We hope this analysis provides a solid foundation for that decision.
Methodology Notes
Labor cost source: Eurostat 2024 manufacturing sector labor cost data. Figures represent fully-loaded employer costs including wages, social contributions, and benefits.
Equipment speed: Based on field-verified effective throughput (6,500 sheets/hour) accounting for loading, unloading, job changes, and operational rhythm. Nameplate speeds (8,000–10,000 sheets/hour) intentionally de-rated for real-world conditions.
Pneumatic baseline: Industry-standard time ranges (25–40 min/pile) verified through facility observations. Midpoint (32.5 min) used for consistency.
Sheet area assumption: 0.70 m²/sheet used to convert annual m² capacity to sheet count. Adjust based on your actual product mix; ROI direction remains consistent.
References
- Eurostat: Labor Cost Survey 2024 (Manufacturing Sector):
https://ec.europa.eu/eurostat/web/products-eurostat-news/w/ddn-20250328-1
https://ec.europa.eu/eurostat/statistics-explained/index.php?title=Wages_and_labour_costs - EU SME Definition: Commission Recommendation 2003/361/E:
https://eur-lex.europa.eu/eli/reco/2003/361/oj/eng
https://single-market-economy.ec.europa.eu/smes/sme-fundamentals/sme-definition_en - Equipment specifications: Industrial blanking/stripping machine technical data (8,000–10,000 sheets/hour nameplate): https://www.apoloinformatica.com.br/arquivos/1721834737.pdf
- Industry benchmarks: Pneumatic vs manual waste removal time studies
- Market pricing: Industrial equipment suppliers (USD 20k–50k range)